
This is article was written by Dirceu Pereira Tiegs, Site Reliability Engineer at Auth0, and originally was originally published in Auth0.
Auth0 provides authentication, authorization, and single sign-on services for apps of any type (mobile, web, native) on any stack. Authentication is critical for the vast majority of apps. We designed Auth0 from the beginning so that it could run anywhere: on our cloud, on your cloud, or even on your own private infrastructure.
In this post, we'll talk more about our public SaaS deployments and provide a brief introduction to the infrastructure behind auth0.com and the strategies we use to keep it up and running with high availability.
A lot has changed since then in Auth0. These are some of the highlights:
-
We went from processing a couple of million logins per month to 1.5+ billion logins per month, serving thousands of customers, including FuboTV, Mozilla, JetPrivilege, and more.
-
We implemented new features like custom domains, scaled bcrypt operations, vastly improved user search, and much more.
-
The number of services that compose our product in order to scale our organization and handle the increases in traffic went from under 10 to over 30 services.
-
The number of cloud resources grew immensely as well; we used to have a couple dozen nodes in one environment (US), now we have more than a thousand over four environments (US, US-2, EU, AU).
-
We doubled-down decided to use a single cloud provider for each of our environments and moved all our public cloud infrastructure to AWS.
Core service architecture
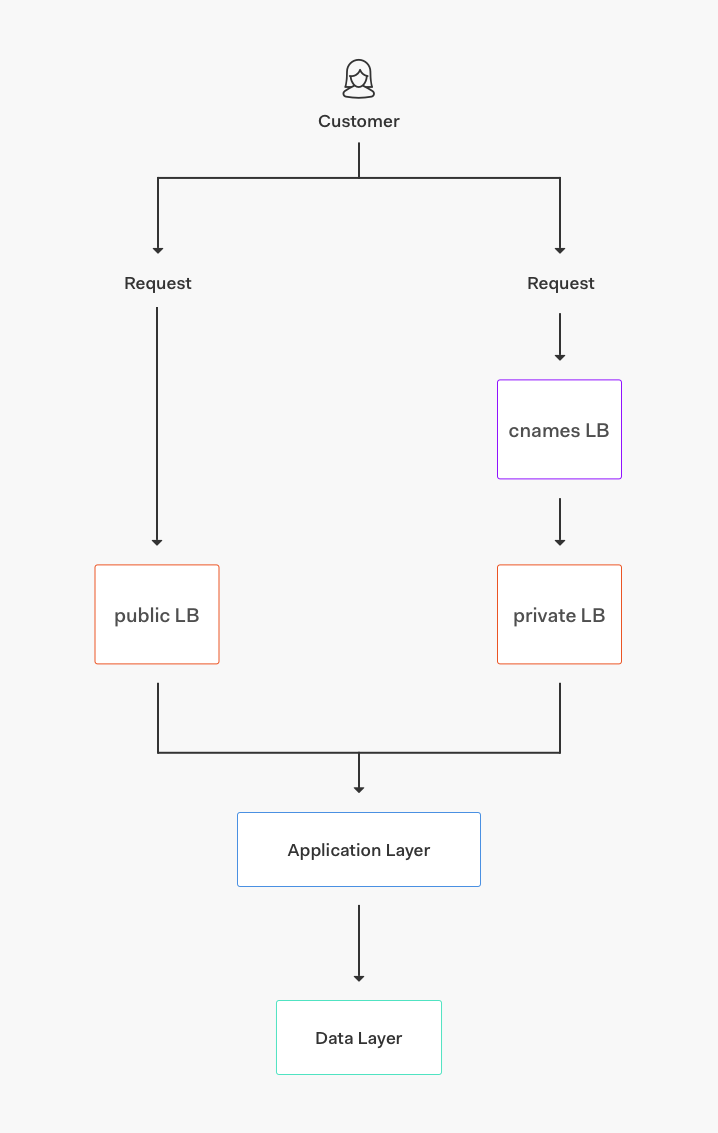
The core service is composed of different layers:
-
Core applications: Auto-scaling groups of servers running different services of our stack (authentication, management API, multi-factor authentication API, and much more).
-
Data storage: Clusters of MongoDB, Elasticsearch, Redis, and PostgreSQL storing a variety of datasets for different applications and features.
-
Transports/Queues: Kinesis streams and RabbitMQ, SNS, and SQS queues.
-
Base services: Services for rate-limiting, bcrypt clusters, feature-flags, and more.
-
Routing: AWS load balancers (ALB, NLB, and ELB from AWS) and some nodes running NGINX as a proxy.
High Availability
In 2014 we used a multi-cloud architecture (using Azure and AWS, with some extra resources on Google Cloud) and that served us well for years. As our usage (and load) rapidly increased, we found ourselves relying on AWS resources more and more.
At first, we switched our primary region in our environment to be in AWS, keeping Azure as failover. As we began using more AWS resources like Kinesis and SQS, we started having trouble keeping the same feature set in both providers. As our need to move (and scale) faster grew, we opted to keep supporting Azure with a limited feature parity: if everything went down on AWS, we could still support core authentication features using the Azure clusters, but not much of the new stuff we had been developing.
After some bad outages in 2016, we decided to finally converge on AWS. We stopped all efforts related to keeping the services and automation platform-independent and instead focused on:
-
Providing a better failover story inside AWS, using multiple regions and at least 3 Availability Zones per region.
-
Increasing usage of AWS-specific resources like auto-scaling groups (instead of using fixed clusters of nodes), application load balancers (ALBs), and more.
-
Writing better automation: we revamped our automation, completely embracing infrastructure as code using TerraForm and SaltStack to provision new Auth0 environments (and also to replace existing ones). This allowed us to grow from partially automated environments doing ~300 logins per second to fully automated environments doing more than ~3.4 thousand logins per second; using the new tooling makes it easier to scale up (and down, whenever it makes sense). The level of automation we achieved is not perfect but is allowing us to grow to new regions and create new environments in a much more convenient way.
-
Writing better playbooks: with more time and focus, we saw that besides automation we also needed better playbooks in order to understand, manage, and respond to incidents related to our ever-growing mesh of services. This vastly improved scalability and reliability while also allowing us to onboard new employees faster.
Writing better automation let us grow from partially automated environments doing ~300 logins per second to fully automated environments doing more than ~3.4 thousand logins per second
Let's take a look at our US environment architecture, for instance. We have this general structure:
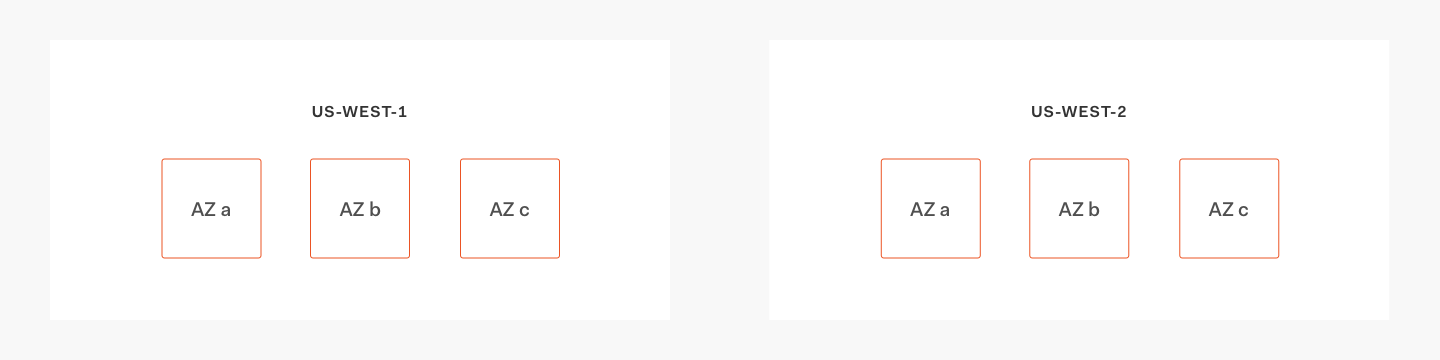
And this is the structure inside a single AZ:
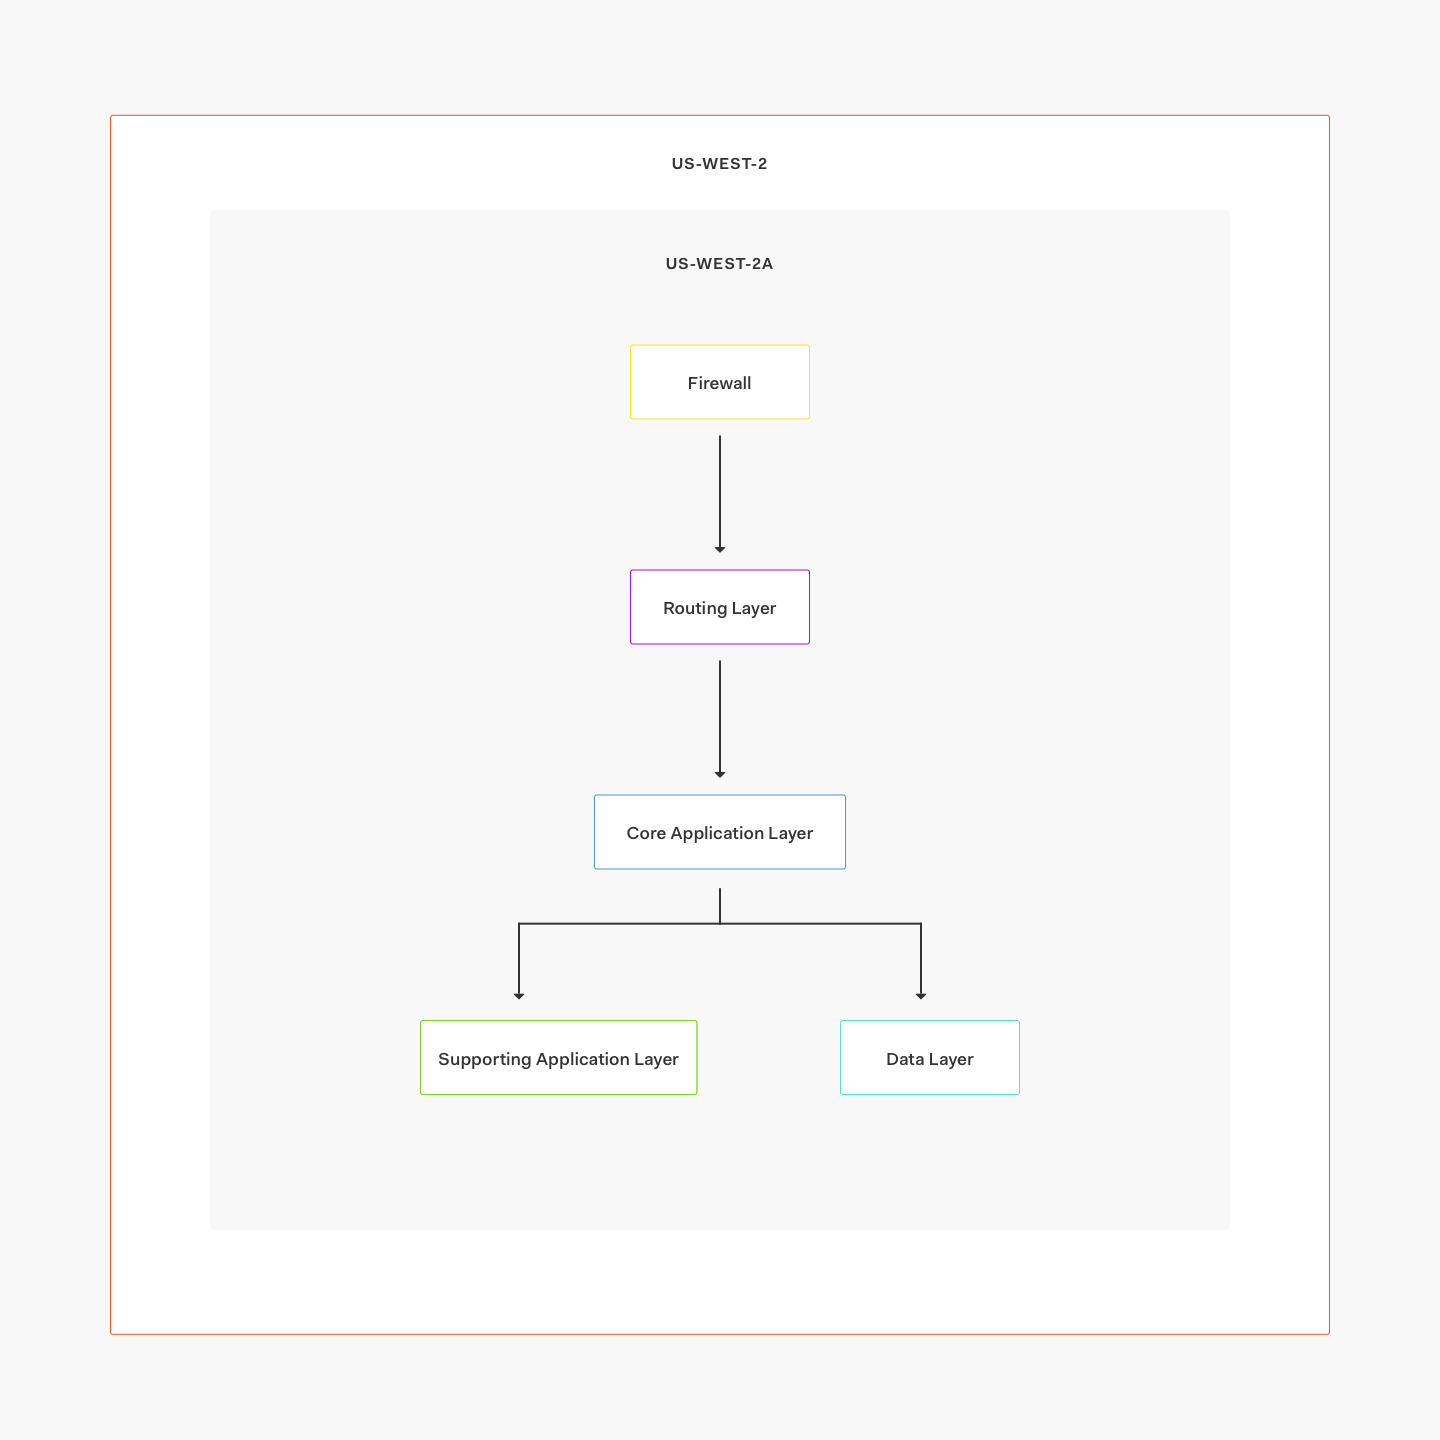
In this case, we use two AWS regions: us-west-2 (our primary) and us-west-1 (our failover). Under normal circumstances, all requests will go to us-west-2, being served by three separate availability zones.
This is how we achieve high availability: all services (including databases) have running instances on every availability zone (AZ). If one AZ is down due to a data center failure, we still have two AZs to serve requests from. If the entire region is down or having errors, we can update Route53 to failover to us-west-1 and resume operations.
We achieve high availability by running all services instances on every AWS availability zone
We have different maturity levels for service failover: some services, like user search v2 (that builds a cache on Elasticsearch) might work but with slightly stale data; still, core functionality keeps working as expected.
In the data layer, we use:
-
A cross-region cluster for MongoDB.
-
RDS replication for PostgreSQL.
-
Clusters per region for Elasticsearch with automated snapshot and restores running regularly to account for the lack of cross-region clustering.
We exercise failover at least once per year, and we have playbooks and automation to help new infrastructure engineers get up to speed on how to do it and what are the implications.
Our deployments are usually triggered by a Jenkins node; depending on the service we either use Puppet, SaltStack, and/or Ansible to update individual or groups of nodes, or we update our AMIs and create new autoscaling groups for immutable deployments. We have different types of deployments for new and old services, and this has been shown to be largely ineffective as we need to maintain automation, docs, and monitoring for something that should be unified.
We are currently rolling out blue/green deployments for some of the core services, and we intend to implement the same for every core and supporting service.
Automated Testing
Besides unit test coverage on every project, we have multiple functional test suites that run in every environment; we run it on a staging environment before we deploy to production, and we run them again in production after finishing a deployment to ensure that everything works.
The highlights:
-
We have thousands of unit tests in different projects.
-
We use Pingdom probes that run every minute to check core functionality.
-
We use a mix of Selenium and CodeceptJS-based functional tests before and after every deployment. The functional test suites test different API endpoints, authentication flows, identity providers, and much more.
Besides unit test coverage on every project, we have multiple functional test suites that run in every environment: staging before deploying to production and again in production after finishing deployment.
CDN
Until 2017 we ran our own, custom-built CDN using NGINX, Varnish, and EC2 nodes in multiple regions. Since then, we transitioned to CloudFront, which has given us several benefits that include:
-
More edge locations, which means less latency for our customers.
-
Lower maintenance costs.
-
Easier configuration.
There are a few downsides, like the fact that we need to run Lambdas to perform some configurations (like adding custom headers to PDF files and things like that). Still, the upsides definitely make up for that.
Extend
One of the features we provide is the ability to run custom code as part of the login transaction, either via authentication rules or custom database connections. These features are powered by Extend, an extensibility platform that grew out of Auth0 and is now being used by other companies as well. With Extend, our customers can write anything they want in those scripts and rules, allowing them to extend profiles, normalize attributes, send notifications, and much more.
We have Extend clusters specifically for Auth0; they use a combination of EC2 auto-scaling groups, Docker containers, and custom proxies to handle requests from our tenants, processing thousands of requests per second and responding fast to variations of load. For more details about how this is built and run, check out this post on how to build your own serverless platform.
Monitoring
We use a combination of different tools for monitoring and debugging issues:
-
CloudWatch
-
DataDog
-
Pingdom
-
SENTINL
The vast majority of our alerts come from CloudWatch and DataDog.
We tend to configure CloudWatch alarms via TerraForm, and the main monitors we keep on CloudWatch are:
-
HTTP errors from our main load balancers.
-
Unhealthy instances in a target group.
-
SQS processing delays.
CloudWatch is the best tool for alarms based on AWS-generated metrics (like ones from load balancers or autoscaling groups). CloudWatch alerts usually go to PagerDuty, and from PagerDuty to Slack/phones.
DataDog is a service we use to store and act on time-series metrics. We send metrics from Linux boxes, AWS resources, off-the-shelf services (like NGINX or MongoDB), and also custom services we have built (like our Management API).
We have many DataDog monitors. A few examples:
-
Increase in response times in
$serviceon$environment. -
Running out of space on
$volumein$instance($ip_address). -
Issue with
$processon$environment/$host($ip_address). -
Increase in processing time for
$serviceon$environment. -
NTP drifting off / clock issue on
$host($ip_address). -
MongoDB replica-set change on
$environment.
As you can see from the examples above, we have monitors on low-level metrics (like disk space) and high-level metrics (like MongoDB replica-set change, which alerts us if there was a change in the primary node definition, for example). We do much more and have some pretty sophisticated monitors around some services.
DataDog alerts are pretty flexible in their outputs and we usually send them all to Slack, sending to PagerDuty only those who should "wake people up" (like spikes of errors, or most things that we are sure that are having an effect on customers).
For logging we use Kibana and SumoLogic; we are using SumoLogic to record audit trails and many AWS-generated logs, and we use Kibana to store application logs from our own services and other "off-the-shelf" services like NGINX and MongoDB.
The Future
Our platform evolved quite a bit in order to handle the extra load and the huge variety of use cases that are important to our customers, but we still have more room for optimizations.
Not only our platform grew, but our engineering organization increased in size: we have many new teams building their own services and are in need of automation, tooling, and guidance around scalability. With that in mind, these are the initiatives in place for us to scale not only our platform but also our engineering practice:
-
Build a Platform, PaaS style: As mentioned before, today we have different automation and deployment flows; this causes confusion and creates a barrier of entry for engineers as it's hard to experiment and scale up without touching too many repositories. We are developing a PoC for a platform (currently running on top of ECS) in which engineers can configure a YAML file and just deploy it to get computing resources, monitoring, logging, backups, and much more. All of that without having to configure it explicitly. This effort is in an early stage and might still change a lot (EKS?). However, we feel we are taking the right direction given our growing size and scalability constraints.
-
Implement smoke tests for every new pull request: besides unit testing (that already runs on each new PR), we want to run integration tests on ephemeral environments wherever that's possible.
-
Centralize our logging solution into just one provider. This might mean moving away from Kibana and using just SumoLogic, but we still need to evaluate feature set, data volume, and more.
-
Automate metrics: Too much of our metric story is manual now: adding metrics-related calls to the code while deploying, and building dashboards and monitors using the DataDog interface. If we use a standard format and naming, we could do things like building dashboards/monitors automatically, extracting metrics from logs instead of explicitly adding calls to the code, and more.
-
Ensure we have auto-scaling and blue/green deployments on every core service. This should come out-of-the-box from our new Platform, but while that is being built and tested we need to improve the scaling/deployment/rollback story for the core services that are still lacking in that regard.