


Analyzing billions of credit card transactions and serving low-latency insights in the cloud

This is a guest post by Ivan de Prado and Pere Ferrera, founders of Datasalt, the company behind Pangool and Splout SQL Big Data open-source projects.
The amount of payments performed using credit cards is huge. It is clear that there is inherent value in the data that can be derived from analyzing all the transactions. Client fidelity, demographics, heat maps of activity, shop recommendations, and many other statistics are useful to both clients and shops for improving their relationship with the market. At Datasalt we have developed a system in collaboration with the BBVA bank that is able to analyze years of data and serve insights and statistics to different low-latency web and mobile applications.
The main challenge we faced besides processing Big Data input is that the output was also Big Data, and even bigger than the input. And this output needed to be served quickly, under high load.
The solution we developed has an infrastructure cost of just a few thousands of dollars per month thanks to the use of the cloud (AWS), Hadoop and Voldemort. In the following lines we will explain the main characteristics of the proposed architecture.
Data, goals and first decisions
The system uses BBVA's credit card transactions performed in shops all around the world as input source for the analysis. Obviously, the data is anonymous, impersonal and dissociated to prevent any privacy issue. Credit card numbers are hashed. Any resultant insights are always an aggregation, so no personal information can be derived from them.
We calculate many statistics and data per each shop and per different periods of time. These are some of them:
- Histogram of payment amounts for each shop
- Client fidelity
- Client demographics
- Shop recommendations (clients buying here also buy at ...). Filtered by location, shop category and so on.
The main goal of the project was to offer all this information to the different agents (shops, clients) through low-latency web and mobile applications. So one demanding requirement was to be able to serve the results with sub-second latencies under high load. And because this was a research project, a high degree of flexibility in the code and in the requirements needed to be handled.
Because updating the data only once a day was not a problem, we opted by a batch-oriented architecture (Hadoop). And we chose Voldemort as a read-only store for serving Hadoop-generated insights, which is a simple yet super-fast key/value store that integrates well with Hadoop.
The platform
The system was built on top of Amazon Web Services. Specifically, we used S3 for storing raw input data, Elastic Map Reduce (Amazon's provided Hadoop) for the analysis and EC2 for serving the results. Using cloud technologies allowed us to iterate fast and deliver functional prototypes quickly, which is exactly what we needed for the kind of project.
The architecture
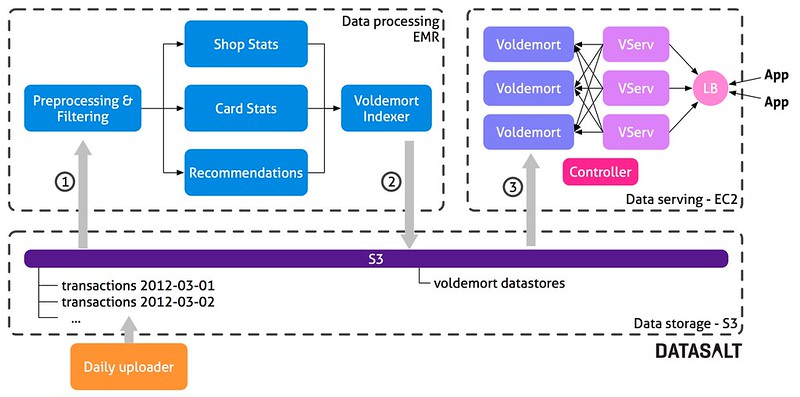
The architecture has three main parts:
- Data storage: Used to maintain raw data (credit card transactions) and the resulting Voldemort stores.
- Data processing: A Hadoop workflow running on EMR that performs all the computations and creates the data stores needed by Voldemort.
- Data serving: A Voldemort cluster that serves the precomputed data from the data processing layer.
Every day, the bank uploads all the transactions that happened on that day to a folder in S3. This allows us to keep all historical data - all credit card transactions performed every single day. All that data is the input for the processing layer, so we recompute everything, every day. Reprocessing all the data allows us to be very agile. If requirements change or if we find a silly bug, we just update the project code and all data is fixed after the next batch. It is a development decision that brings us:
- A simplified code base & architecture,
- Flexibility & adaptability to changes,
- Easy handling of human errors (Just fix the bug and relaunch the process).
Once a day the controller starts a new Hadoop cluster on EMR and launches the processing flow. This flow is composed of approximately 16 Tuple MapReduce jobs that calculate various insights. The last part of the flow (Voldemort indexer) is in charge of building the data store files that will later be deployed to Voldemort. Once the flow has finished, the resulting data store files are uploaded to S3. The controller shuts down the Hadoop cluster, and sends a deploy request to Voldemort. Then, Voldemort downloads the new data stores from S3 and performs a hot-swap, replacing the old ones entirely.
The technologies
Hadoop and Pangool
The whole analytics and processing flow is implemented using Pangool Jobs on top of Hadoop. This brings us a good balance between performance, flexbility and agileness. The use of tuples allows us to carry information between the flow using simple data types (int, string) and at the same time we can include other complex objects (like histograms) with their own custom serialization.
Also, because Pangool is still a low level API, we can fine-tune a lot every single Job when needed.
Voldemort
 Voldemort is a key/value NoSql database developed by LinkedIn, based on Amazon's Dynamo concepts.
The main idea behind Voldemort is dividing data in chunks. Each chunk is replicated and served in the nodes of the Voldemort cluster. Each Voldemort daemon is able to route queries to the node that keeps the value for a particular key. Voldemort supports fast reads as well as random writes, but for this project we use Voldemort as a read-only datastore, replacing all data chunks after each batch process. Because data stores are pre-generated by Hadoop, query serving is not affected by the deployment process. This is one of the advantages of using this read-only, batch approach. We also have the flexbility to change the cluster topology and rebalance the data when needed.
Voldemort provides a Hadoop MapReduce Job that creates the data stores in a distributed cluster. Each chunk of data is just a Berkeley DB B-tree.
Voldemort's interface is TCP but we wanted to serve data using HTTP. The VServ is a simple HTTP server that transforms incoming HTTP requests into Voldemort TCP requests. A load balancer is in charge of sharing out queries between all the VServs.
The computed data
Statistics
Part of the analysis consists in calculating simple statistics: averages, max, min, stdev, unique counts, etc. They are implemented using well known MapReduce approaches. But we also compute some histograms. In order to implement them efficiently in Hadoop we created a custom histogram that can be computed in only one pass. Moreover, we can compute all simple statistics for each commerce together with the associated histograms in just one MapReduce step, and for an arbitrary number of time periods.
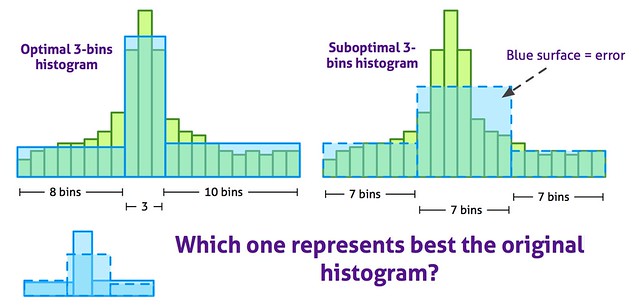
In order to reduce the amount of storage used by histograms and to improve its visualization, the original computed histograms formed by many bins are transformed into variable-width bins histograms. The following diagram shows the 3-bins optimal histogram for a particular histogram:
The optimal histogram is computed using a random-restart hill climbing approximated algorithm. The following diagram shows the possible movements on each hill climbing iteration:
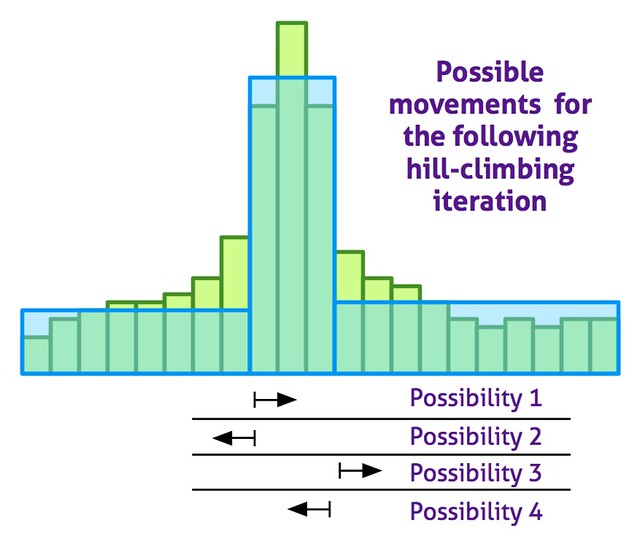
The algorithm has been shown very fast and accurate: we achieved 99% accuracy compared to an exact dynamic algorithm (implemented from this paper), with a speed increase of one factor.
Commerce recommendations
Recommendations are computed using co-ocurrences. That is, if somebody bought in both shop A and B, then a co-ocurrence between A and B exists. Only one co-ocurrence is taken into account even if a buyer bought several times in both A and B. The top co-ocurring shops for a given shop are recommendations for that shop.
But some improvements need to be applied to that simple idea of co-ocurrences. First, the most popular shops are filtered out using a simple frequency cut because almost everybody buys in them. So there is no value in recommending them. Filtering recommendations by location (shops close to each other), by shop category or by both also improves the recommendations. Time-based co-ocurrences produce hotter recommendations vs "always true" recommendations. Limiting the time where a co-ocurrence can happen results in recommendations of shops where people bought right after buying in the first one.
Hadoop and Pangool are the perfect tool to compute the co-ocurrences and generate the recommendations, although some challenges are not easy to overcome. Particularly, if one buyer is paying in many shops, the number of co-ocurrences for this credit call will show a quadratic growth, making the analysis not scale linearly. Because this is rare case, we just limit the amount of co-ocurrences per card, considering only those where the buyer bought the most.
The cost & some numbers
The amount of information to serve in Voldemort for one year of BBVA's credit card transactions on Spain is 270 GB. The whole processing flow would run in 11 hours on a cluster of 24 "m1.large" instances. The whole infrastructure, including the EC2 instances needed to serve the resulting data would cost approximately $3500/month.
There is still room for optimizations. But considering the solution is agile, flexible and in the cloud, the price is quite reasonable. The cost of the system running in an in-house infrastructure would be much cheaper.
Conclusions & future
Thanks to the use of technologies like Hadoop, Amazon Web Services and NoSQL databases it is possible to develop quickly solutions that are scalable, flexible and prepared to stand human failures at a reasonable cost.
Future work would involve the replacement of Voldemort by Splout SQL, which allows to deploy Hadoop-generated datasets and extends low-latency key/value to low-latency SQL. It would reduce the analysis time and the amount of data to serve as many aggregations could be performed "on the fly". For example, it would allow for aggregated statistics over arbitrary time periods, which is something impossible to pre-compute.
 HighScalability Team
Reader Comments (8)
I stopped reading after "key/value NoSql database developed by LinkedIn"
Not interested in anything from idiots who don't even know how to salt user password hashes.
This was a confusing description and the architecture seems poorly laid out/explained. Also, how is node failure handled?
Answering to "dev"'s comment: Node failure under EMR is handled transparently by Amazon, and node failure in the Voldemort cluster is handled by Voldemort's fail-over capabilities. We just have to specify the desired replication factor and data chunks are deployed accordingly.
Feel free to ask anything else you might be interested in and which you think is not explained well enough.
Thanks Ivan and Pere, this is very interesting! I have a quick question. 270 GB isn't that big of a dataset, and since you're ultimately serving HTTP I'm wondering what lead you to choose Voldermort vs. something along the lines of couchdb? I'm also curious about Splout, which you seem to have developed internally. This to me appears to represent a fairly hefty engineering effort given the data sizes - could you explain the advantage of Splout for this particular use case vs. (dare I say) a sharded RDBMS? Many thanks!
Hi Stephan, thanks for the comment and the questions. We chose Voldemort for three reasons: speed, simplicity and good integration with Hadoop. We think very few databases can pull data from Hadoop efficiently. We are interested in databases whose data structures can be pre-generated by Hadoop and which can deploy Hadoop files in an all-or-nothing fashion and without affecting query serving. This adds a safety layer to the system and decouples totally the backend from the frontend. In turn, this makes the architecture simpler, removing the need for incrementally streaming state between processing and serving.
ElephantDB is another one that meets these requirements and that we could have chosen, but we had previous positive experience with Voldemort already.
I'm not sure whether your question was more like whether we could have used a CouchDB-centric system as a replacement for Hadoop + Voldemort. If that's the case, we don't have enough experience with CouchDB right now to tell if that's an interesting option or not.
Regarding Splout SQL, indeed you can actually see it as a sharded RDBMS - but read-only, and tightly integrated with Hadoop, which is what we desired. By being read-only it actually becomes much simpler to manage than a traditional RDBMS, and by integrating it with Hadoop we enable applications to move data from processing to serving easily and safely, with all of the benefits I mentioned above.
Regarding data size, take into account that 270 GB is only one year data for Spain, but the application will potentially serve data for several years and countries. What's more, because requirements change quickly, the output magnitude is still unknown as it may grow every time we add a new feature.
Hope this answers your questions, otherwise feel free to ask.
Thank you Pere, this makes a lot of sense - I now realize the advantage of Splout or ElephantDB is not having to do the crunching on your initial datastore via MR, then ETL to a separate one that needs its own maintenance + obvious performance advantages of being read-only + (I imagine) smaller codebase to maintain (apparently Elephant is 2k LoC!). Cheers!
This is an interesting matter but I just wished that it is explained more.
What was the most difficult thing you encountered when working with this type of data (besides scale)?
Having spent 10+ years analyzing credit/debit data myself, I'm just curious :)
Thanks,
Jon Wren