Performance at Scale: SSDs, Silver Bullets, and Serialization
 Monday, June 23, 2014 at 9:00AM
This is a guest post by Aaron Sullivan, Director & Principal Engineer at Rackspace.
We all love a silver bullet. Over the last few years, if I were to split the outcomes that I see with Rackspace customers who start using SSDs, the majority of the outcomes fall under two scenarios. The first scenario is a silver bullet—adding SSDs creates near-miraculous performance improvements. The second scenario (the most common) is typically a case of the bullet being fired at the wrong target—the results fall well short of expectations.
With the second scenario, the file system, data stores, and processes frequently become destabilized. These demoralizing results, however, usually occur when customers are trying to speed up the wrong thing.
A common phenomena at the heart of the disappointing SSD outcomes is serialization. Despite the fact that most servers have parallel processors (e.g. multicore, multi-socket), parallel memory systems (e.g. NUMA, multi-channel memory controllers), parallel storage systems (e.g. disk striping, NAND), and multithreaded software, transactions still must happen in a certain order. For some parts of your software and system design, processing goes step by step. Step 1. Then step 2. Then step 3. That’s serialization.
And just because some parts of your software or systems are inherently parallel doesn’t mean that those parts aren’t serialized behind other parts. Some systems may be capable of receiving and processing thousands of discrete requests simultaneously in one part, only to wait behind some other, serialized part. Software developers and systems architects have dealt with this in a variety of ways. Multi-tier web architecture was conceived, in part, to deal with this problem. More recently, database sharding also helps to address this problem. But making some parts of a system parallel doesn’t mean all parts are parallel. And some things, even after being explicitly enhanced (and marketed) for parallelism, still contain some elements of serialization.
How far back does this problem go? It has been with us in computing since the inception of parallel computing, going back at least as far as the 1960s(1). Over the last ten years, exceptional improvements have been made in parallel memory systems, distributed database and storage systems, multicore CPUs, GPUs, and so on. The improvements often follow after the introduction of a new innovation in hardware. So, with SSDs, we’re peering at the same basic problem through a new lens. And improvements haven’t just focused on improving the SSD, itself. Our whole conception of storage software stacks is changing, along with it. But, as you’ll see later, even if we made the whole storage stack thousands of times faster than it is today, serialization will still be a problem. We’re always finding ways to deal with the issue, but rarely can we make it go away.
Parallelization and Serialization
The table below provides an example of parallelism and serialization with a server and storage device, from the software application down to storage media. Individual steps in the process may support sophisticated queues and parallelization mechanisms. Even so, for any given transaction, and for some groups of transactions, the required steps still must occur in order. Time accumulates with each step. More time per transaction equates to fewer transactions per second.

This sequence of steps presents a simplified, small component – in this case, the storage component – of one server. There are a variety of other components at work in that same server. Certain other components (e.g., a database application), tend to be cumulatively-chained to storage. We could create a similar sequence of steps for a database application, and where the database application leverages system storage, we would chain the two tables together. We could construct similar macro-level models for networks, web-services, cache services, and so on. Many (or all) of these components are linked together to complete a transaction.
As stated earlier, each component involved in a transaction adds time to the cumulative baseline. Improving each part takes a different set of tools, methods, and skills. Often, when stuck with a performance problem, we think it’ll be easier to throw money at it and try to buy our way out. We buy more servers, more processors, faster disks, faster network cards and switches, and on and on. Sometimes, we get lucky with one of those silver bullets. But when we don’t get lucky, here’s what it looks like.
Suppose we’ve built the next killer application. It’s getting really popular, and breaking under the load. At the rate we’re growing, in 3 months, we’ll need a 10x performance improvement. What do we do?
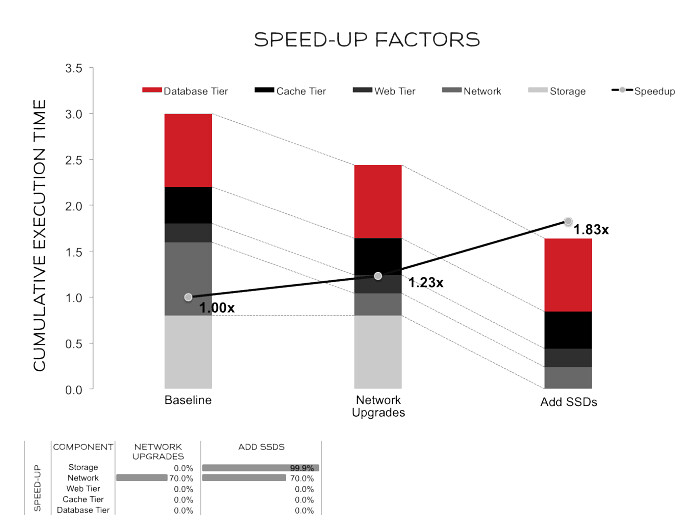
We might place replicas of our system around the world at strategic locations to reduce network latency and demand on our core system. We might upgrade all of our servers and switches from 1 Gb/sec to 10 Gb/sec. We might add SSDs to various parts of our system. Suppose these improvements reduced 70% of our network-related processing time, and 99.9% (a ~1000x improvement) of our storage time. In our application (modeled below), that gets us an 83% improvement. That’s not even double the performance, and we’ve already made a substantial investment. At this point, you might be thinking, “We sped up storage so much that it’s not even visible on the graph anymore. How could a 1000x improvement in storage performance and a bunch of network expense only get us an 83% speed-up?”
The answer is in the graph. A 10x improvement overall requires that the cumulative execution time (left vertical axis on the chart) go from 3.0 to 0.3.

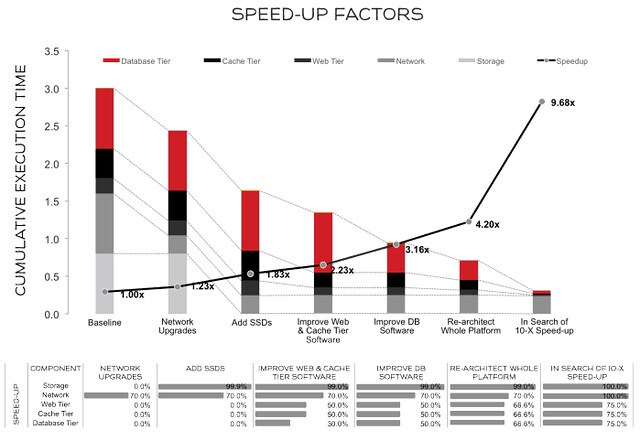
Getting that 10x improvement will require vast improvements all across our environment. Let’s suppose that the network cannot be sped up any further (requiring our network providers and/or the speed of light to improve are said by some to be equally difficult). The graph below is a sample of other changes and resultant speed-ups required to reach 10x.

Notice that we took four more major steps to achieve this kind of broad performance gain. First, we made a measurable improvement at the web and cache tier, doubling their speed. Second, we did the same for the database tier, doubling its speed. That got us to a 3.16x overall performance improvement. Since that wasn’t enough, we took a third step: We also re-designed the whole platform, and through a heroic effort that improved all three platforms, increased their speed to be 3x faster than they were at baseline. That got us to a 4.2x improvement in performance.
See how elusive that 10x speed-up is? Suppose we hired a bunch of superstars to help us complete the journey…
So, fourth, the superstars brought some amazing new skills, code, tools, and perspectives. We got the web, the cache, and the database tier to a 20x speed-up over the original design. We also made another 1000x improvement with the SSDs. That didn’t do much for us, but one of those new hotshots swore up and down that all we needed was faster SSDs (even hotshots fall victim to silver-bullet obsession, sometimes). In the end, we didn’t quite hit 10x, unless we round-up. Close enough.
Now, let’s get back to reality. If we really need these kinds of across-the-board massive speed-ups, think of the amazing demands that would be placed on our development teams. Let’s assess our teams and capabilities through a similar lens. Will we need 10x the developer skill? Will that 10x boost come from one person? Will we need 10x the staff? 10x the test resources? That’s probably not realistic, at least, not all at once. Finding the right places to invest, at the right time, is a critical part of the process.
And in the process, we need to stay methodical, analyze our gaps, and find the most prudent ways to fill them. In my experience, prudence isn’t exciting, but it works.
When faced with a scaling problem, many people often assume they can solve it by throwing hardware at it – that mythical silver bullet. If you think there’s an easy solution available, and it happens to have some SSDs, by all means, try it! If it’s not enough, prepare for a comprehensive journey. Apply what we’ve covered here with your own applications, your own infrastructure, and your own team. Be open minded; you might need across-the-board improvements to reach your goals. Engage superstars where you can, and keep an eye out for serialization; it’s the anti-silver bullet.
- Gene Amdahl is often credited as the first person to identify and document these problems. You can read more about it here: http://en.wikipedia.org/wiki/Amdahl's_law.


Reader Comments (5)
Er, in that case you want to look at throughput bottlenecks in req/sec, not latency in, right?
Unless your requests are fully independent and can thus be scaled horizontally, latency is a direct factor in RPS as the longer they take the fewer you get. I believe this is part of what Aaron is referring to - deserialization. The more serial activities it takes to handle the request the less you can accomplish in a given unit of time. RPS is a second (or third) order metric, latency is a step further in that it provides the tool to analyze where you can expect to see a performance improvement. For sequential/serial operations the latency of those operations is your ultimate limiting factor.
In the example scenario, consider the difference between a system which does not maintain user session state and one that does. If the session state requires transactional access to a resource which can not be accessed concurrently in a safe manner your maximum RPS is a function of the latency of that operation. For example, if this resources takes 10ms for each access you can achieve no more than 100 r/s. If you have two of these your r/s drops in half. But measuring RPS won't tell you where your bottleneck is or where to re-evaluate code/design - it is too broad of a metric. How will you know where the bottleneck is by simply measuring how many requests per second you are processing?
Granted, knowing latency of your operations requires more knowledge and analysis, but that is rather the point. With latency measurement you can actually model improvements as it is a direct variable rather than a derivative. If I alter the speed of operations I alter the req/s. How, exactly, does one directly alter reqs/s?
Then again, I may be completely misunderstanding Aaron's post.
Cheers,
Bill
Hi Randall. Thanks for commenting. And thank you, Bill, for elaborating.
This article emphasizes improving throughput by reducing the various kinds of latency in a transaction.
In the context of this article, req/sec involves both throughput and latency. Latency and throughput are intrinsically linked. If it takes less time to complete a transaction (latency), then more transactions may be completed in a given unit of time (throughput). If I can get 1 req/sec (1/1), that's great. But if I can get 1 req/0.1 sec (1/0.1), I've just gotten a ten-fold gain req/sec.
"Er, in that case you want to look at throughput bottlenecks in req/sec, not latency in, right?"
It depends on how the system is "breaking". Maybe it's able to handle all of the incoming requests, but with unacceptable response times.
"latency is a direct factor in RPS as the longer they take the fewer you get."
"If it takes less time to complete a transaction (latency), then more transactions may be completed in a given unit of time (throughput)."
That is all true if everything is happening sequentially (i.e. your system only handles one request at a time and all operations involved are synchronous).
I HIGHLY recommend that you guys take a look at this presentation (especially slides 23-31) given by Baron Schwartz at Velocity 2012 (and get the video if possible):
"Benchmarks, Performance, Scalability, and Capacity: What's Behind the Numbers?"
http://velocityconf.com/velocity2012/public/schedule/proceedings
Direct link: http://tinyurl.com/odroa79
Best regards.
The point that 10x latency reductions are generally really hard to get (unless your original app was very inefficient) is fine: both true and well-demonstrated. If the post had clearly said "many customers don't see a latency drop proportionate to the SSDs' greater speed and they're disappointed, and this is why that happens", it'd've been great: that's a point not enough people understand.
The problem is that it's about latency, but suggests it's about throughput (mostly through that "traffic is growing" scenario). Edge serving, for example, is great for reducing perceived end-user latency, but does not tend to increase throughput--your ping time is not your bandwidth. Likewise, when steps within a request run sequentially, that mostly affects latency, not throughput. On the other hand, "throwing hardware at it" is often a workable and necessary part of scaling up to higher traffic, even though steps like adding servers to the Web tier often won't make the Web cluster respond _faster_ (i.e., reduce latency).
If I told my performance consultant we'd be getting more traffic and they said "well, we should focus on improving latency 10x with edge servers and a frontend rewrite and stuff, because latency and throughput can be related", they wouldn't remain my performance consultant for long. Or, to the point, if load tests showed the bottleneck was IOPS on my MySQL box and they said "don't bother trying SSDs; DB time is under 10% of a typical request's latency right now", I would, again, look at them a little bit funny.
If you can acknowledge that some explicit treatment of throughput vs. latency might have enriched the analysis, and that the distinction is actually important to folks figuring out how to scale to higher traffic (or to other folks figuring out how to decrease lag at current traffic levels), I'm happy. Either way, I'm done blabbin', because if that's a controversial conclusion, I really have no hope here. :)